

Corporate media outlets have found a new click-bait genre: the terrifying e-bike. A teenager on a sidewalk or a delivery rider weaving through a crosswalk on a machine that blasts through city streets like a rocket. Social media warriors and neighborhood busybodies are all in a tizzy.
In the US, the standard e-bike is a pedal-assist bicycle that tops out around 20 mph. These have become wildly popular because they have just enough juice to flatten hills and make it easier to carry heavy bags (or kids) without breaking a sweat.
A large share of the panic is a labeling problem. The machines doing the most alarming things on sidewalks and in intersections are electric motorcycles. Without moving your feet, you can soar up to 60 mph.
Even though there is a percentage of the population doing dumb things on e-motos, the traffic safety moment is wasted if we let the fearmongers frame e-bikes as something that deserves immediate political intervention. Instead, we have a chance to put the hierarchy of safety controls back on the table.
Learn how to rank hazards if you really want to prevent the most injuries
The hierarchy of safety controls is a ranked list of ways to deal with a hazard. You start at the top and only move down when a stronger option is not available. The most effective are at the top, and the least effective at the bottom. (Since humans are feeling creatures who sometimes think, it’s not surprising that the least effective safety treatments are the ones that get the most attention.)
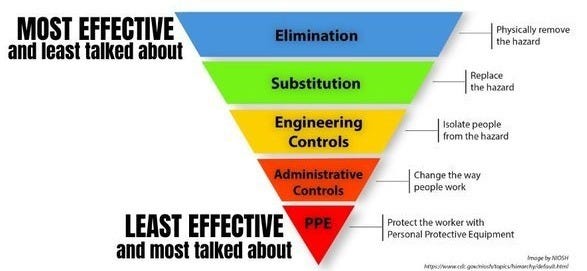
Elimination. Get rid of the hazard. The dangerous thing is no longer there, so it can’t hurt anyone. Unplug and remove a machine, stop using a toxic chemical, etc.
Substitution. Change the source of harm. Use a safer chemical instead of a toxic one, use a lower-voltage tool, replace a process that can crush a hand with one that can’t, etc.
Engineering controls. Leave the hazard in place, but build something that keeps people away from it or limits how bad contact can be. Guards, ventilation, barriers, etc.
Administrative controls. Change how people work. Training, procedures, warning signs, schedules that limit exposure, “only trained staff may enter,” checklists. These help, but they also fail when someone is rushed, tired, untrained, or unsupervised.
PPE (personal protective equipment). Put protection on the person who is still exposed. Gloves, goggles, helmets, respirators, earplugs. This is last because it does not remove the hazard and does not separate people from it. It only reduces harm if the gear is the right kind, worn correctly, and still working when something goes wrong.
The further down the pyramid you go, the more you’re asking of people when the system itself should have done more.
The public conversation about e-bikes and e-motos lives almost entirely at the bottom two rungs. Meanwhile, the hazard that actually fills trauma centers and morgues is motor vehicle crashes.
In 2023, the United States recorded about 6.14 million police-reported traffic crashes. Of those, 71.7 percent were property-damage-only, 27.6 percent involved injury, and 0.6 percent were fatal. That same year, 40,901 people were killed and an estimated 2.44 million were injured. The CDC separately counted about 2.8 million ER visits for car crash injuries.
Medical expenses from car crashes cost a whopping $31 billion in 2019. CDC put the 2023 cost of crash deaths alone at more than $457 billion, counting medical care and the value of lives lost. The public pays a share of that bill whether or not it wants to. Taxpayers subsidize about 9% of all economic crash costs.
Cars are associated with roughly 40,000 deaths and 2.4 to 2.8 million injured or ER-treated people every year. E-bike deaths were 91 in 2023 and 97 in 2024, with a total of 310 from 2017 through 2024. Rising e-bike injuries are real. That’s because, thankfully, so many more people are now using e-bikes for many of the short trips that used to be car trips.
If we took the top of the pyramid seriously, we would direct policy energy and advocacy resources at the hazard that has such a high share of the blame for traffic violence.
None of this requires pretending e-motos are harmless. High-power machines on sidewalks are a genuine nuisance and, in some cities, a genuine injury problem. What is not worth doing is treating every battery-assisted bicycle like it’s anywhere near the threat of motor vehicles.
Should we focus at all on e-bikes? Sure. On the topic of traffic safety, I propose 0.2% of our attention focus on e-bikes and 99.8% of our attention focus on cars. That aligns nicely with the real world situation we’re currently faced with.
If you find yourself in an academic mood, here’s some reading material:
NHTSA, Traffic Safety Facts 2023 Data: Summary of Motor Vehicle Traffic Crashes (DOT HS 813 762) — 6,138,359 police-reported crashes; 71.7% property-damage-only, 27.6% injury, 0.6% fatal; 40,901 killed; 2,442,581 injured. Also on ROSA P.
CDC, About Transportation Safety — more than 2.8 million emergency-department visits for motor-vehicle crash injuries in 2023; crash deaths in 2023 cost more than $457 billion (medical costs plus value of lives lost).
NHTSA press release, “Traffic Crashes Cost America Billions in 2019” — $340 billion in economic costs; nearly $1.4 trillion including quality of life; $30 billion / 9% paid from public revenues.
NHTSA, The Economic and Societal Impact of Motor Vehicle Crashes, 2019 (revised) — full cost study; medical expenses $31 billion ($30.9 billion in the report text); same $340 billion / $1.4 trillion / 9% public-revenue figures. Direct PDF: dot_78698_DS1.pdf.
Coaston et al., “Inpatient Trauma Care Costs in the US From 2012 to 2021,” JAMA Network Open — motor-vehicle collisions had the highest median inpatient cost among trauma mechanisms, $15,412 (IQR $8,718–$29,376). PubMed record: PMID 40986303.
NHTSA 2019 cost study, source-of-payment tables (as reproduced from the report / HCUP-NIS) — Medicaid 19.3% and Medicare 13.6% of hospital costs for motor-vehicle crash injuries.
CPSC, Micromobility Products-Related Deaths, Injuries, and Hazard Patterns, 2017–2024 — 310 e-bike fatalities from 2017 through 2024; 91 in 2023 and 97 in 2024; landing page: cpsc.gov report page.
NHTSA, Bicyclists and Other Cyclists, 2024 Data — useful context on pedalcyclist fatalities/injuries (FARS does not cleanly isolate e-bikes).
Thanks for talking sense into this conversation. I had some guy shaking his fist at me for slowly riding my manual bike on the sidewalk. Sorry my bad, I should have been riding on the narrow road of speeding cars whose shoulder is filled with parked vehicles. There’s no reason a 5 minute bike ride to the grocery store should be that dangerous!
Some auto drivers are better than others. Most, though, at least try to follow the laws of the road and you can make a risk assessment.
However almost ALL bicyclists/e-bicyclists pay absolutely no attention to any traffic rules whatsoever, and it’s truly dangerous to everyone on the roads.
I called in a pizza for pickup (on foot), and while crossing a wide avenue with my purchase had to pause two-thirds in for two consecutive cyclists going at speed in the wrong direction. Then I resumed my crossing when another cyclist ran the intersection in the right direction but against the light.
By the time my path was clear the light had changed and cars were headed toward me.
I could have been an auto statistic because of cyclist rule-breaking.
I walk a lot and this is what I see all the time.
Certainly cars need attention, but most operators of bikes and e-bikes are a menace and a nuisance.
I’m pretty spry and so manage to dodge trouble most of the time but not everyone is. This issue deserves immediate intervention of some kind.