Transportation experts measure the wrong things
Here's why "good" grades on a traffic engineering report card are signs of death and destruction.
Planners & engineers use the wrong metric to evaluate traffic conditions
In the heart of the 20th century's automobile boom, the United States faced a new challenge: managing the surge of traffic on its expanding road networks. The 1965 Highway Capacity Manual, published by the Transportation Research Board, introduced Level of Service (LOS) as a solution.
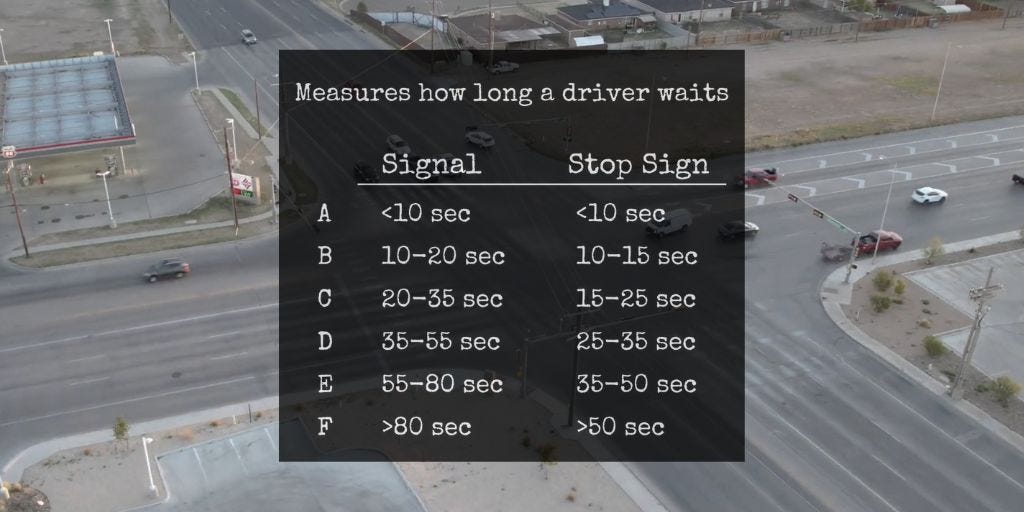
This system, grading road performance from A to F based on vehicle delay, promised to order the chaos of traffic and guide infrastructure development. It was a brilliant marketing move, because we all understand letter grades. We know A is good, F is bad, and C is passing but needs improvement. From a persuasive point of view, the experts swept away any chance of debating the premise that minimizing vehicle delay was the best goal.
LOS quickly became the standard for evaluating traffic conditions on a corridor or at an intersection. The illustration below was one of the widely copied reference points for students and professionals to visualize the grading scale.
An A indicated free-flowing traffic. Efficiency, hooray! An F represented congestion. Inefficiency, boo!
Although this system offered a clear method for evaluating road performance, it also set in motion a host of unintended consequences.
Level of Service rewards speed.
LOS has nothing to do with safety. Nothing.
Anyone who tells you differently is either accidentally wrong or intentionally deceptive. LOS's focus on minimizing vehicle delay directly ties to vehicle speed. Each grade, from A to F, correlates with faster driving.
The colossal failure among transportation professionals was applying the highway free-flow mindset to residential and commercial streets. The whole idea of ripping apart cities with “convenient” highways came from the wrongheaded idea that cars should not only be in constant motion, but that they should be moving as fast as the system will allow.
We know speed kills. But the transportation industry lacks self-awareness, so the response to high-speed traffic is a confused shrug: “Gosh, we’re not sure why people are speeding. Maybe it’s because they have to wait too long at stop lights. We should improve the LOS.”
The push for speed, inherent in LOS, increases traffic crashes, incapacitating injuries, and fatalities. As vehicle speeds rise, so does the severity and likelihood of crashes. Blame physics: kinetic energy escalates the destructive potential of collisions. A vehicle's kinetic energy nearly doubles from 20 to 30 mph. From 20 to 40 mph, kinetic energy is four times greater.
KE = ½ mv2 (where m is mass and v is velocity)
Higher speeds result in disproportionately higher kinetic energy. This energy, combined with the force exerted in crashes, contributes to the severity of crashes. All those years ago, Isaac Newton was trying to tell us that traffic calming is a pretty big deal. Here’s how DALL-E illustrated crash energy at 20, 30, and 40 mph:
Understanding the impact of speed differentials is crucial in comprehending the severity of vehicle crashes.
From 20 to 30 mph: When a vehicle's speed increases from 20 to 30 mph, the kinetic energy nearly doubles. It’s not a linear 50% increase. A crash at 30 mph is not marginally more severe than one at 20 mph; it's disproportionately more destructive, underscoring the increased risk associated with even moderate speed increases.
From 30 to 40 mph: At 40 mph, a vehicle's kinetic energy is almost four times greater than at 20 mph. Collisions at 40 mph are significantly more violent, causing greater damage and a substantially higher risk of serious injury or fatality. Now think how common it is to see 45 mph speed limits on roads with lots of driveways and intersections.
The force is a product of mass and acceleration or deceleration. In a crash, a vehicle’s sudden deceleration at higher speeds exerts enormous forces on both the vehicle and its occupants. Physics explains traffic injuries, but the standard traffic report cards give no attention to safety.
People walking and rolling hit by a motor vehicle at 40 mph have significantly lower survival chances compared to being struck at 20 mph. So at a minimum, wouldn’t it make sense to only use LOS grades on facilities that have only vehicles? And from there, engineers could come up with a way to make safety the driving force behind the grading system.
Check out these resources if you’re interested in going deeper on Level of Service or find yourself challenged by a traffic engineer:
Evolving Use of Level of Service Metrics in Transportation Analysis. This document provides case studies on how various states and metropolitan planning organizations are developing and implementing new performance metrics that differ from the traditional automobile LOS model. These case studies delve into the experiences of agencies working to achieve goals related to safety, financial constraints, and the environment, highlighting the evolving use of LOS in transportation analysis. The case studies can be a great resource for understanding the shift in perspectives regarding LOS and its application in modern transportation planning. The full case studies and resources can be accessed through the U.S. Department of Transportation's website.
Road Diet Informational Guide by the Federal Highway Administration (FHWA). This guide includes a section on Level of Service (3.3.3 LOS) and provides insights into how road diets (reconfiguring roads to allow for more space for pedestrians, cyclists, and mass transit) impact LOS. It’ll help you understand the practical implications of LOS in road planning. You can find this guide on FHWA's website.


Our MPO here in Pinellas County created a new index called the Multimodal Accessibility Index (MAX Index) to replace LOS. https://forwardpinellas.org/blog/pinellas/introducing-the-max-index-a-new-way-forward-beyond-level-of-service/
The tough part is getting public works departments in the 25 local governments to adopt it and change their car-centric mindset.
To be more general. Engineers were optimizing the wrong objective function. Throughput the number of vehicles (or occupants) passing a point per time period in only part of what needs to be maximized. Death, property damage and injury are also costs that road design and pricing need to take into account.